
The Opportunity
Overview
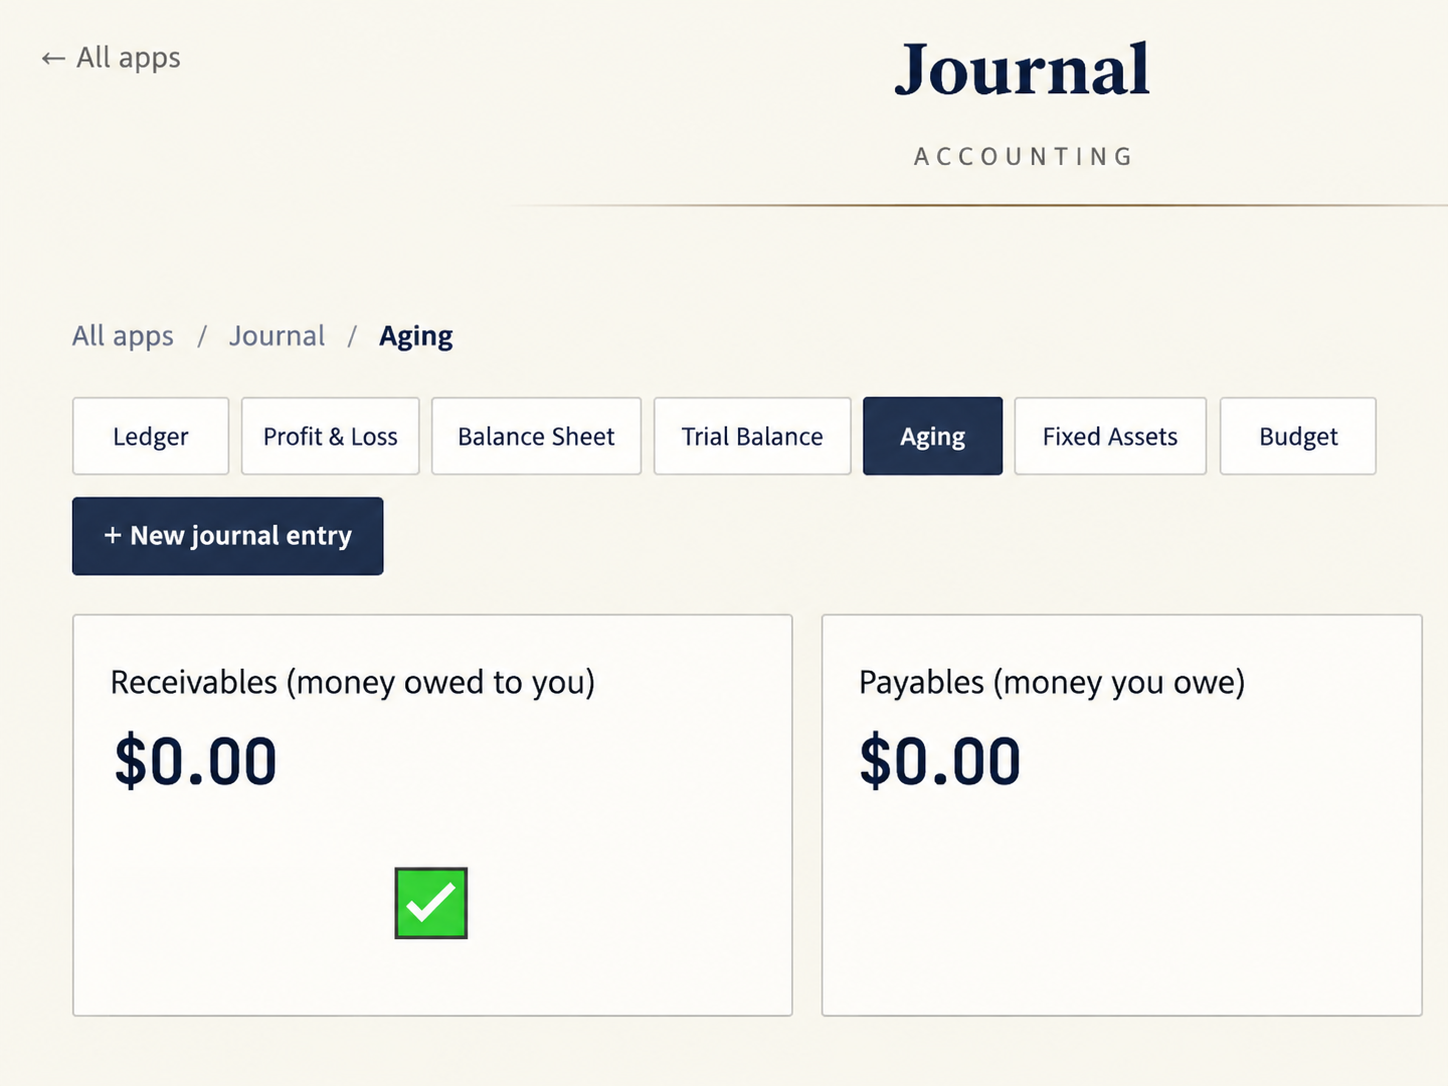
Double-entry bookkeeping that runs itself. Every sale, purchase, and depreciation entry lands in the ledger automatically — debits and credits always balance, because the system won’t let them not.
The Challenge
Problem
The data to answer “how’s the business doing” already exists — it’s just scattered across five screens. By the time someone compiles it into a real answer, it’s yesterday’s news.
That approach breaks down in predictable ways:
- Revenue lives in Sales, net income in Accounting, stock health in Inventory — no single view
- Turnover, LTV, and cash conversion require manual spreadsheet math
- Nobody notices a slow week until the month is already over
The Solution
Approach
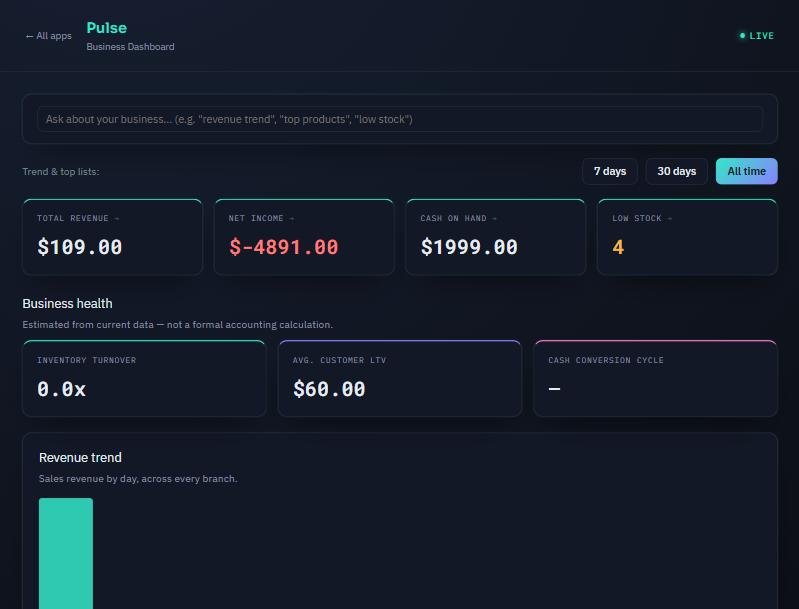
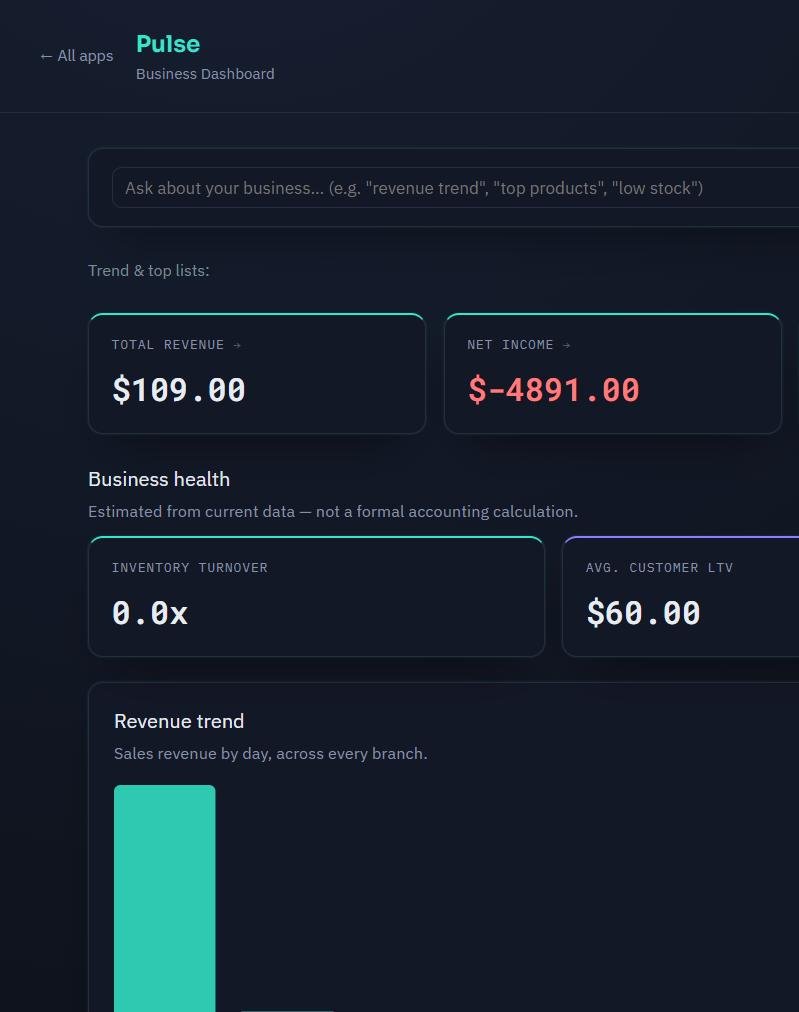
Pulse reads live from every module and renders it as one glanceable page, with a plain-language search box that jumps straight to the relevant chart.
The solution included:
- Revenue, net income, cash on hand, and low-stock tiles — each links back to its source module
- Inventory turnover, average customer LTV, and cash conversion cycle, computed automatically
- Daily revenue trend chart with 7-day / 30-day / all-time ranges
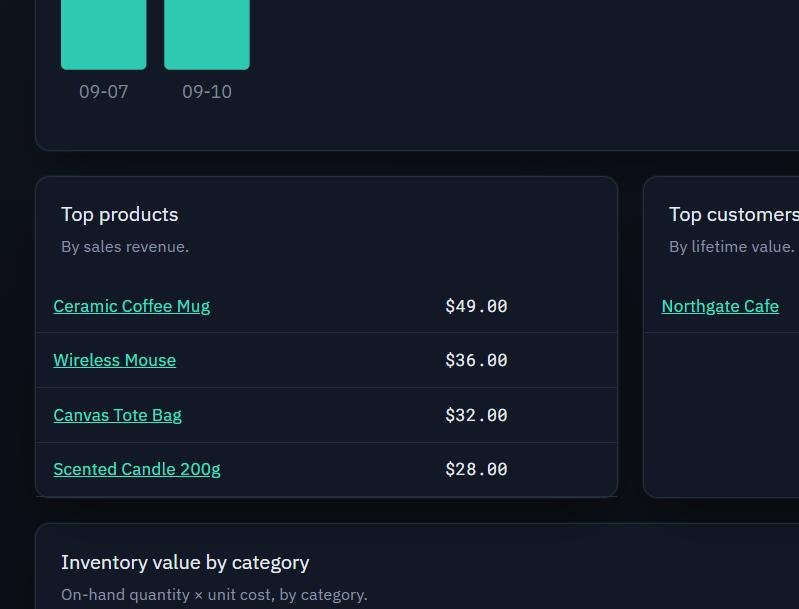
- Top products and top customers by revenue
- Inventory value broken down by category
- Scheduled report previews (daily/weekly/monthly)
- A natural-language search bar ("top products", "low stock") that jumps to the right chart
The Impact
Outcome
What it delivers:
- A single screen that replaces five tabs and a spreadsheet
- Business-health metrics computed the moment the page loads, not once a quarter
- Every number links back to where it came from
Significant decrease in human errors